Wednesday, October 31, 2012

This storm will be a good test of Market Profile

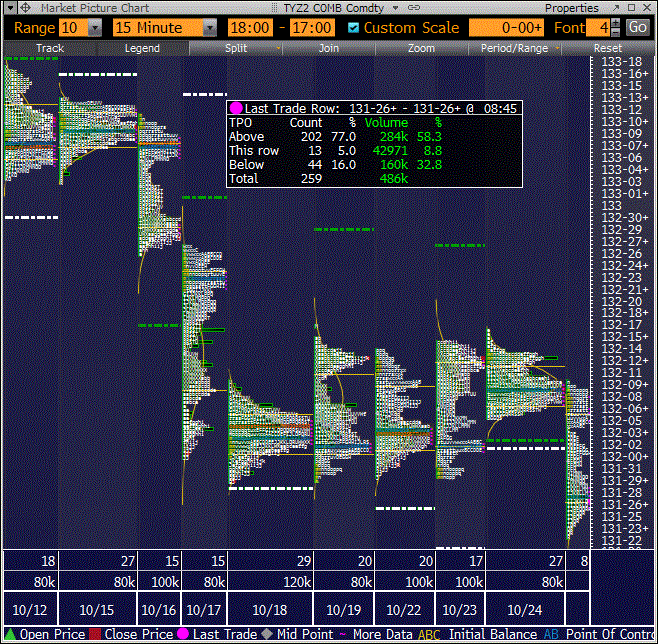
The 10yr treasury future (ZN) has 3 days of "price discovery" all agreeing on a single price zone as the new weekly mode (132-20 --> 132-22) with volatility 8 ticks below the lower mode region and 10 ticks above the higher mode region.


So far, it seems to me that the market (and market profile) are telling us that we have a new medium term center of value.  If this becomes a weekly mode (highly probable), then we should have a good 18-24 ticks of range trading opportunity over the next few trading days.  Since there was little opportunity for traders to front-run the month end buying trade, it will be interesting to see what this afternoon looks like, since the US Treasury index extension is so small (0.02)  In Market Profile terms, the market looks like it is filling in a gap in the recent months price action.

There is a very good video at the cmegroup that describes how the market tends to fill-in gaps in the building of longer term profiles.  If we combine that model with our own, we can see that the move from one bell curve to another tends to occur from large buying /selling activity.


Just by eyeballing the past weeks price action, it looks like on Friday Oct 26, there was large buying activity with heavy volume between 8:30 and 10:00  AM around 132-10 that pushed us out of the prior bell curve and into this current bell curve.

My expectation is for this current bell curve to hold for the rest of the week (range trade for the next couple days), but next week the next round of auctions will start to weigh on the market.  I'm hoping there will be a pop towards the end of this week providing a good entry to setup a short for next weeks 10yr and 30yr bond auctions.

govttrader out...

Friday, October 26, 2012

Am I the only one who sees the weekly mode asserting itself?

This is the last 30 days of profiles.  I've drawn white boxes around the recent congestion zones that would make up multi-day profiles that could be combined into a single bell curve.  Note that each recent congestion zone lasts about 7 trading days.  While this is not a rule, it gives us a simple yardstick to measure the current trading region, and should help us answer the question, "what next."


Seems to me that we have probably completed the bell curve for this region (at the least, the most recent regions bell curve has been well defined).  The important question is, which way will the market break next.  Classic bell curve / market profile theory states that the market will look to fill in gaps that were left behind from moves away from previous longer period bell curves.

Since bloomberg only keeps 30 days of this data, I'll use my imagination and draw equivalent price region boxes on the 10yr note price graph going back 3 months.  We can just imagine the profiles with some common sense. 


Even with this added information, we still don't know with certainty where the next period's bell curve will setup.  The general pattern of selloff into 10yr and 30yr auctions followed by rally into month-end has not taken place yet in October.

I've talked to a number of rates strategists who think the extra-small Oct extension of 0.02 combined with the uncertainty in the Nov-6 election may mute the month end rally in UST that we have grown accustomed to.  If that is the case, then the current price region will continue to grow (range trade) until the election.  This would mean a very large move after the election as the concept of "filling the gap" will play out with even larger discrepancy between the current bell curve size and the "gap". 

Thursday, October 25, 2012

Lets start it up again

So where does the market stand now?  Value has been setup lower today in UST.  After the weekly mode @ 132-04 attracted the market one time, today's high mode @ 131-27 has pulled the market back to its center of value.  A similar situation has occurred in stocks as 1407 has acted like a center of gravity for the past 3 days.  It isn't clear yet which way the UST breakout will go, so for now, I'm planning on waiting for the next move away from the mode to determine what my next trade will be.  On the 6 month timeframe, everything other than oil has converged...so no good info there.


Just for fun

If I had indeed sold ES @ 1417 (a dream) I would cover here @ 1402.  And, to add salt to the wound, if I'd got long 10yr notes again @ 98-05 (i thought about it), i'd get flat those here too @ 98-13.


Not that I did either of those things...tisk tisk...

Trying to play the chop...just sold my 10yr notes @ 98-07

So I'm flat and looking for the next trade (i won't retire on 6 ticks, but its more than enough to pay the rent).  The 29bln 7yr auction eclipses the 5bln 10yr POMO buyback in duration...so i'm content being flat for now.  Ideally, i'll have another chance to buy a dip later today, as I am still bullish on UST and bearish on stocks.


govttrader out...

1416.75 was the high in ES....i mised by 0.25

...maybe next time??

Update - i just bought 10yr notes @ 98-01

At the bottom of the weekly bell curve because of economic data, and there is 10yr POMO in 1.5 hours...feels like a good trade to me.


govttrader out...

Back to Micro Bonds- We hit the bottom of the weekly bell curve...BTFD

With 132-04 being the weekly mode..and yesterdays high of 132-16...lets do a little simple math.  16-4 = 12.  So, 132-04 - 12 = 131-24.  Where was the low his morning?  131-23+ before the Durable Goods number.  After the Durable Goods data (strong headline number - horrible internals, as the only strength was in a Boeing Aircraft order), the market dipped below the bottom of the bell curve (a gift) and has rebounded back inside up to 131-28 at present.  I'm expecting the weekly mode at 132-04 to reign in the market at some point today, so i like buying dips.


I'm still bearish on stocks (i'm selling ES @ 1417 if we see it), but this dip today in UST is a buy to me.  I'll bet that tomorrows GDP report will show the weakness that was hidden in today's Durable Goods internals.

govttrader out..

Wednesday, October 24, 2012

One of these things is not like the other....


Does this chart really need explanation??   Who is the odd man out??

FOMC statement: can i say "called it"

Nothing else to say here.

http://www.federalreserve.gov/newsevents/press/monetary/20121024a.htm

2's, 3's, 5's and 7's at the highs after 5yr auction

Need i say anything more?  With another 29bln 7yr paper being sold tomorrow, is there any indication of selling to "setup" for the 7yr auction??   I don't think so either.  Demand for risk free UST paper is as healthy as ever.

I think, that the world is waiting for the Fed to say "we are watching and waiting, and will continue to monitor the economy and provide stimulus as we see necessary to lower unemployment and help the economy grow.  We see no changes to our current open market operations at this time...but will continue to monitor the situation and make changes and adjustments as we see fit in the coming months and years.  ok.thanks.bye"

In my personal opinion...its pretty ludicrous to expect the Fed to say much of anything else until after the election.  My only surprise is that bonds aren't doing even better than they are.  The extension for the month of October is pretty small (0.02 in UST)...so maybe that's why the weak UST price action.  Still, there is a week to go.

I'm not usually an elliot wave guy...but come on...


This is a 6 month chart.  Any follower of my blog would know that i tend to not even look at 6 month charts...the info is just too old.  I'll make an exception in this case for two reasons...(1)because the above chart is one time horizon larger than i normally look....and (2), because the conclusion i draw from the larger time horizon agrees with my short term view...which is lower 10yr and 30yr UST yields.

Are there any elliot wave practitioners out there who would like to comment on my interpretation of the wave count?


govttrader

So its no surprise, the bond mkt has built value at slightly higher prices

With stocks stabilizing at somewhat near the recent lows, bonds are stabilizing at somewhat near their recent highs (not high enough if you ask me...but i digress).


So, the big question...will anything big happen before FOMC at 2:15?  My guess, probably not..

For those longer term view types...here are stocks making lower highs and lower lows...and breaking threw the trend-line support with conviction after flirting with it about a week ago. 


My crystal ball foresees 10yr yields dropping like a stone in the next 7 days.  You heard it here first...

govttrader out...


Tuesday, October 23, 2012

At least stocks have caught up to crude oil


So should the question now be....what are stocks and crude oil trying telling to tell UST and EUR??


Back in ZN market profile space, the same price area has indicated its gravitational pull.  The move out of this area will be humongous...but that may not happen until after FOMC tomorrow.


Buying dips is still the name of the game.  Perhaps stocks will have another roller coaster day (cross your fingers) and we will have an opportunity to buy a dip in UST.


govttrader out...

Complacency...the big traders are waiting for Wednesday to trade

Given the moves in stocks these past few days, the comparable moves in treasuries have been incredibly flat.  Its pretty clear to me that the large treasury traders have not been active in the market recently.  Perhaps they are waiting for Wednesdays FOMC meeting to get out of the way before they get back into the market.  Either way, the moveds in UST have been pretty muted given the moves we have seen in the stock market recently.  The stocks vs bonds trade diverges some more overnight.


Monday, October 22, 2012

Stocks vs bonds diverge some more...when will the madness stop?

Stocks are down 7 points from last nights close, and so are 10yr notes.  For reference, when stocks go down, UST are supposed to go UP.


I'm not sure when its going to happen, but there will be a day when buying the bottom of the bell curve in 10yr notes or 30yr bonds results in big bucks and no whammy.

On the market profile front, guess what price has reigned in the market again?  Thats right....132-03....big time.


I'm praying (again) for an overnight move to the bottom of the bell curve (hopefully before NY comes in) so that I can BUY IT.  I know that it would make sense for me to go short if i thought that mkt was going to trade down to the bottom of the profile...and then get long at the bottom of the profile....but i have almost zero confidence that it will...i just HOPE that it will.

govttrader out...

Weekly ZN mode - 132-01+ --> 132-03+ and coiling

When a price region repeatedly reigns in the market like a spring over a number of days, its time to switch sensors to maximum sensitivity.   The longer the market coils around a single price, like it has the last 3 trading days, the larger and more violent will be the move out of that trading range. 


Its for this reason that I will only initiate a position from the outside edge of a bell curve.  Part of me thinks I should be more patient and willing to risk either a flat day or a small loss day to make more...but the other part of me is ultra risk averse (that's fear and greed...battling it out inside my own head), and only want to put on, and be in, home runs (as in, if i don't have maximum conviction in a trade, I either don't put it on, or I exit as soon as possible).  Perhaps I should be a little more patient with my exits (with a specific stop loss after i've lost conviction).  Something to think about.  

For the moment, I still think that ZN @ 131-24 will be THE price to buy if offered in the near future.  I'm not so sure i'll get the chance to buy it, and i may buy before that if i see a buying pattern before i see that price, but just to be clear, 131-24 looks like a golden level right now.  I still want to find a way to get long within the premise of my model.

I'm flat - but the day isn't over yet

Only made 2 ticks on my 10yr position, but its better to book small profits and live to fight another day, than end up giving it all back on a weak position.  I'll be frustrated if stocks fall out of bed and treasuries pop higher...but....the rules are the rules.  At least now that i'm flat I have a clear head and can wait for the next high probability trade.


govttrader out...

Looks like the mode (and VWAP) has shifted to 132-03

So, how to handle this?  Well...my long position is no longer the high probability trade it used to be, so i'm looking to exit my position around 98-15 unless stocks (ES) take a dive.   I will attempt to re-buy the market if we get down towards the bottom of the new bell curve. 

Staying 2 sided - what is the argument against my long 10yr position?

Just playing devil's advocate on my own position (long 2 units of 10yr notes), I see a few factors which are bearish for 10yr prices.

1)  upcoming 5yr and 7yr supply
2)  potential for Fed to disappoint (no mention of additional Treasury QE) on wednesday
3)  potential mode shift in ZN to 132-03

Factors 2 and 3 are the most significant.  I've read a handful of bank strategists say they don't think the Fed will specifically mention additional UST purchases in Wedneday's statement.  Of course, nobody things they won't continue some kind of UST QE after twist ends...but that decision / comunication will most likely come from Dec 12's meeting.  Still...there are some in the market who will be dissapointed on wednesday if the Fed doesn't act or communcate such future action...and so that is a bearish force for UST.

A ZN mode shift down to 132-03 would also lower the bottom of the bell curve to 131-23 (implies 10yr notes @ 98-00).


My net opinion is still bullish on UST, but I won't be taking a position into Wednesday's FOMC meeting because of the binary risk.  I may trade in the market after the announcement though.

Watching how ZN trades around here should provide some clarity on the mode shift situation.  Seems today is yet another day when I can't be complacent about my position.

govttrader out...

So what is the target for this position?

Between the stocks vs bonds divergence, month-end approaching, and today's 30yr POMO buyback, i see no reason why 10yr notes shouldn't approach yesterday's high prices.  I'll be watching the tape closely today, especially around the mode in ZN.  If we stay here at 132-03 in ZN for another 1 1/2 hours, the mode will shift (just staying consistent with mkt profile).  However, that doesn't mean the mode couldn't shift again if we spend any more time up around 132-07.   Too many "ifs" for me, so for now, i'm just watching the tape and sitting on my long.


govttrader out....

Just bought 2nd unit of 10yr notes @ 98-10 --> Position Avg cost 98-11+ Long 2 units

This is the bottom edge of the 2nd bell curve.  Unless something has fundamentally changed, the ZN high mode of 132-07 should reign in the market at least one time.  This should mean approx 98-18 on 10yr notes.

For those readers who would argue that the upcoming 7yr supply will weigh down the market: my reply would indicate that 7yr supply hasn't weighed down the market before...so why should this week be any different? 


Also, the recent divergence between stocks and bonds has become even more pronounced today.  Until we get new information, or drastically different price action, I want to be long UST, and so i am.


govttrader out...

Ok, i am involved now...just got long 10yr notes @ 98-13

This was a very long night session..as the market moved in a very slow fashion (so far) with not much volatility...just a drag to lower prices  Someone sold 100mm 10yr notes in the screens down at 98-13 just now, and I was the lucky recipient of a portion of that.  So far, the market is just sitting here...we will see what happens next. 


From a market profile perspective, we are at the bottom of the inner bell curve.  I still like buying UST vs stocks, and i want to be long for month end...and we are at the bottom of the first bell curve (3 ticks lower to the next bell curve).


Friday, October 19, 2012

Patience can be frustrating...Universe, please let me get long 10yr notes!!!

I must admit it is frustrating to want to have a position, but ones trading rules do not allow it.  In this case, I want to be long US Treasuries (10yr- 30yr space).  My hope is that Sunday night  / Monday morning there is some rhetoric out of Europe that causes UST to dip into Thursday's price region (132-04 in ZN).  This chart of 10yr yields vs ES is just screaming at me to buy 10yr notes.


govttrader out..

This divergent move between stocks and bonds is crazy today...can't wait to buy a dip in bonds

I have every confidence that UST will catch up to this move in stocks (occurring on good volume)..i just pray that there is a dip in 10yr notes that I can buy before it happens.


Why couldn't stocks make this move when UST was at the bottom of the bell curve?

You will notice this move in stocks is vastly under-performing UST today.   My interpretation of this move is because UST was above the day's center of value when stocks made their move.  For this reason, the large treasury traders could not buy bonds cheap, so, they haven't gotten involved yet.


However, this move in stocks gives me even more conviction to buy a dip in UST over the next week if we get one.

Existing home sales in 1 min...maybe they will provide some good volatility to trade

Update:   no such luck..numbers came on the screws

Wasn't paing attention and my ZN bid was hit @ 132-01..thankfully

More interesting, stocks have just dropped to the bottom of their inner bell curve. I'm tempted to either buy ES here @ 1443 for a return to 1451 one time.


Sold the top of the first inner bell curve

So, I just sold i unit of ZN @ 132-06, and my plan is to cover when we get back down to the mode @ 132-01.  However, if stocks make an attempt at a leg higher (lets say ES above 1453) then I might wait for ZN to move towards the other side if its bell curve, which would be 131-28.  The market has spent a lot of time just sitting in this price zone the past 2 days.  This should give confidence to either a large seller or a large buyer that they can initiate a position with good liquidity.  Will be important to watch for that over the next couple trading days.


Did I say sideways...cuz here it is...

So, 132-01 has announced its presence with 8 straight hours of sideways activity with no interuptions.


The inside bell curve is pretty easy, and so is the 2nd order inside bell curve.
132-05 --> 131-28+
132-09 --> 131-25

After some volatility (if there is any) we will both attempt to trade and re-calibrate these levels.  Overnight volumes have been anemic thus far.

govttrader out...

Thursday, October 18, 2012

Expecting UST to setup sideways in this area

I'm still waiting for an opportunity to buy UST (i was clearly too early in my attempt yesterday).  The gap has been closed between stocks and bonds in short term RV, and the recent capitulation of UST longs should create a space for fresh buying when the time presents itself.  However, its likely that the market will continue to move sideways for another day before a large buyer will come in and use a dip to buy the bottom of some days bell curve.  When that happens, I'm expecting a pretty chunky uptrade...but its hard to know exactly when it will happen.  I don't see another large downtrade coming up in the near future...so i'll continue to measure the bell curve and find opportunities to buy dips.  Hopefully, that will allow me to catch the ride when the next large buyer takes a shot.  In the mean time, we'll just need to wait for tomorrow's center of value to show itself before we can calculate the bell curve.


So 132-04 is price controlling the market

So we know that 132-04 is controlling the ZN market because the top of the bell curve just capped the uptrade and we have traded just about all the way to the other side (131-31 is the bottom of today's bell curve...will we get there?).  About 20k ZN contracts traded at 132-09/8+...plus whatever cash trades the dealers got hit with.


So what is the next trade?

After the last 2 days of weakness, treasuries have caught up with stocks and EUR (our current risk assets).  Recall that in the 2nd half of the month as we approach month-end, I am bullish on treasuries, and this month should be no different.  I fully expect at some point before the end of the month for ZN to outperform ES.  The only asset in our risk matrix that has failed to keep pace is oil.  Perhaps if there is another spike down in oil, there is a long CL / long ZB trade to put on.


In strict Market Profile space, 132-04 is about to become the new mode in ZN.  This should expand the top of the inner bell curve to 132-09


Just got flat - sold my 7yr notes @ 98-18

Not the result I was looking for...but...the market seems to be saying that ZN @ 132-03 is the new center of value (mode shift??) so I've cut my losses to a miniscule amount.  Now that I'm flat I can look for the next trade with a fresh perspective.


New ZN center of value to trade around...132-03

And it looks like the inner bell curve is pretty tight at 4 ticks...131-31 --> 132-07


Wednesday, October 17, 2012

In Market Profile - what is a trading day?

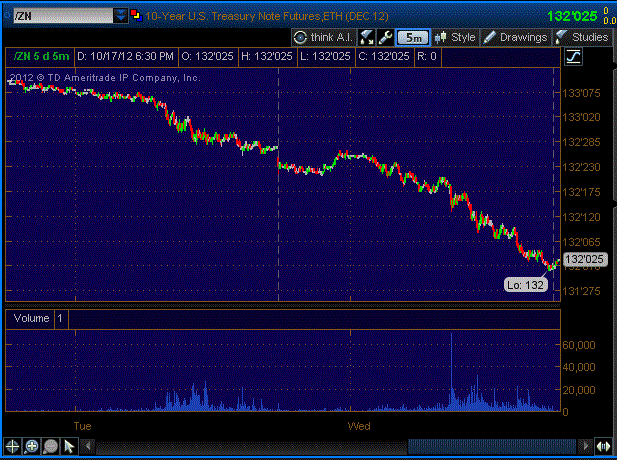
Today is a great example of a trading day that will most likely span 2 calendar days.  This type of trading day is the most frustrating, because all our adrenaline that normally serves us well in the high volatility markets will exhaust us if it just keeps dragging on.  A trading day is the space on a price graph that delineates a trading idea or session of interaction between 2 dueling forces (buyers and sellers).  The buyers want the sellers to capitulate...and vice-verse.  Until one of them wins, the market tends to not go anywhere.  While it looked like the sellers won today, until we get clear confirmation of either a "P" up or a "b" down, we can't determine that we are out of a value tethered price region (even if the mode shifts).  We won't know the answer to that question until we get more horizontal price action.


For all those traders out there trying to understand today's slow consistent downtrade

First, I feel your pain (i'm net down on the day, though selling bonds as a hedge in the afternoon helped mitigate).  There are some days where the volatility of the price action feels like 2-3 trading days compressed into a single day.  Today was not one of those days.  There are days where it feels like only 1/2 of a trading day has gone by come the end of the day, and those days can be painful and nerve wracking for traders accustomed to the high volatility days.  It is conceivable that tomorrow feels like an extension of today..as though the clock should still read Wednesday come tomorrow.  The story isn't over yet, so we'll just have to wait and see.

govttrader out...

Didn't get flat...going home long

I made a few ticks making markets in the last 30 minutes of trading, but ended up going home long.  Given that we are at the bottom of the extended bell curve, I would only buy the market in ZN or be flat here...so, i'm long 1 unit.  If I did not trade at all today, I would have wanted to buy the market at the end of the day, so I'm happy with my position.

My only concern was that slug of 100k contracts that traded after the 8:30 housing numbers...that flow dominated the UST market all day long.  We will see if the extreme edge of the bell curve (132-00) captures the market, or if there really is an oversupply condition which will force me to get stopped out.


Bought back my 30yr @ 95-08+

So i'm legging out of my 7/30 steepener....i'm back to being long 7yr (i legged my ZN into 7yr cash).  Am i catching a falling knife?   My plan is to play for the end of day volatility (dealers will sometimes intentionally trap day longs at the lows, and then let the market pop up a couple ticks to breathe).  I'm offering out my 7's a tick above..hopefully i'll be going home flat so i can play the game again tomorrow.

Just to be clear - get long VOL

Today is an example of a slow-motion long liquidation.  The ZN liquidity providers of the liquidity providers (the 2nd set of buyers from this morning) are throwing in the towel as stocks return to their noon levels.   The question to answer now is...will the sellers from above take profits...or will there be a new set of large buyers when ZN trades below 132-00.  If not for both, then this mornings sellers will create an oversupply condition, and the market will stay down for at least another day.  Otherwise, the whole move from today could reverse.  Its a pretty wild range of options, so i'd want to be long rate VOL here.


This day is frustrating

I just sold 1 unit of 30yr @ 95-16+ to hedge my long ZN position for the 3pm bond hit.  I'm just a tad short now, and in the 7/30 steepener.  Will try to buy back the 30yr to get long again in what i suspect will be a downtrade sometime in the next hour.


How to explain today's price action in bonds

Between 8:30 and 8:45 AM, over 100,000 ZN contracts were sold into the market.  This is the most important piece of info we need to explain what is happening in UST space.  The avg price of that sale was 132-16.   The "liquidity providers" seem to have turned over their positions to fresh hands..by the looks of it at an avg price of 132-11+.  So, we have shorts siting in the money from 132-16, and slightly underwater longs sitting at 132-11+.  So far, the longs have been unwilling to try to run the shorts out.  Ultimately, one of these players will need to force the hand of the other.  For the moment, its hard to tell who that will be, but the pressure is on the longs.  I won't be adding to my long position near these levels because the probability of correctly determining the winner isn't better than 50/50.  I should be able to tell by the price action if one side makes a run for the other...but that will require staring at the tape for the next few hours.  The only reason to hold the position as we sit at the lows is because we are below the bottom of the inner bell curve using yesterday afternoons value area. 

If we use the extended bell curve, ZN can go all the way down to 132-00 before bringing in fresh buyers.  There is no way to know beforehand if that will play out.

So, to attract fresh buyers. either ZN goes down to 132-00, or stocks take a dive in the next couple hours.  Otherwise, given the positive housing data, we will need some bad headlines out of Europe, or something of that nature to reverse the downtrade in treasuries. 

On the flip side, if stocks stay strong, then today's longs will either blow out or just sit there. If the longs blow out, then the morning sellers will get their "b down" and potentially an oversupply condition.

The perfect "FU" trade today would be a pop in stocks which scares the longs, forcing them to long liquidate and sell into weakness.  If that long liquidation in turn brings the market down to 132-00 (it probably would) where fresh buyers come in to challenge the morning sellers....well that would be the perfect "FU" to the longs such as myself.

Going back to our trading rules, is it possible that today's sellers will create a "b down" and get an oversupply condition?  Its always possible, but this doesn't tend to be what those days look like.  Unfortunately, only time will tell.  Sometimes the supply conditions develop slowly, and the same can be said for reversals.  Those tend to be the harder days to trade.  Today is shaping up to be one of those days.  In either case, patience is required to find the answer.

govttrader out...

Just added to my long @ 132-12

I'm long 2 risk units now...avg price 132-12+


Quick Recap - good housing starts number gave us the pop we were looking for

No, I didn't predict that ES would trade above 1454 (1454.25 so far)...i just knew that if ES traded up to 1454, that i wanted to buy UST.   So, using ZN, i bought 132-13+, and i'm targeting 132-19+ (initial VWAP) or 132-22 (initial mode) to take profits.  I was bidding 95-10 for the 30yr bond, but 95-12 was the low (so far) so no joy there.  After looking at the curves (5/7, 7/10, 10/30) it appears that 10's are a little rich recently, so i'm putting my longs in 7's or 30's.


govttrader out